From Documentation
(uploaded a new version of "File:StrongScalingPlot.jpg": Better Labelling.) |
(uploaded a new version of "File:StrongScalingPlot.jpg": Reverted to version as of 18:36, 12 February 2010) |
(No difference)
| |
Latest revision as of 15:39, 12 February 2010
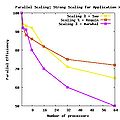
This is a plot that illustrates the parallel scaling efficiency of a hypothetical program on 3 different HPC clusters.
File history
Click on a date/time to view the file as it appeared at that time.
| Date/Time | Thumbnail | Dimensions | User | Comment | |
|---|---|---|---|---|---|
| current | 15:39, 12 February 2010 |  | 400 × 400 (33 KB) | Merz (Talk | contribs) | Reverted to version as of 18:36, 12 February 2010 |
| 15:37, 12 February 2010 |  | 400 × 400 (33 KB) | Merz (Talk | contribs) | Better Labelling. | |
| 14:36, 12 February 2010 |  | 400 × 400 (33 KB) | Merz (Talk | contribs) | This is a plot that illustrates the parallel scaling efficiency of a hypothetical program on 3 different HPC clusters. |
- You cannot overwrite this file.
File usage
There are no pages that link to this file.